My personal website can now be found here
Fall 2018 Research Projects
With the school term now finished, here are some links to a few of the research projects I did this semester.
- Predicting Fama French Factors Using Machine Learning Techniques
- PDF, Github repository
- This paper applies a variety of machine learning models to the task of predicting two of the Fama-French factors, SMB and HML. For each year of predictions the models are trained on the previous four-hundred months of data. Predictions are made for the period of 1988-2018. The performance of trading strategies based on these predictions are assessed. Our results suggest that machine learning models do possess predictive ability for these factors.
- Rating the Critics: An In-Depth Look at New York Times Film Critics and the Academy of Motion Picture Arts and Sciences Voting Membership
- HTML, Github repository
- This analysis considers three related questions: are film critics from the NYT able to predict box office hits, what kind of storylines do NYT critics favour, and, what best picture nominees tend to win the Oscar.
- Toronto’s Evolution of Attitudes Towards Real Estate
- PDF, Github repository
- This report looks to measure the evolution of Toronto’s attitude towards real estate via applying natural language processing techniques (LDA and sentiment analysis) to newspaper articles.
Data Science Movie Review Project Up on Github
Recently completed a class project using the NYT movie review API. HTML report can be found here, with underlying code here. It was a cool opportunity to do some web scraping and practice model building. I will probably move away from WordPress in the near future given it does not play particularly nice with Jupyter notebooks (and Github Pages looks much nicer!).
Fantasy Hockey 2018 Draft Resources Up on Github
Finally got the opportunity to upload some of the draft tools I used this year to Github. I used a combination of a PostgreSQL database full of player stats, and a Jupyter Notebook for data wrangling and visualization.
Two plots which I found quite helpful in my drafting:
1. This shows the 2017 vs 2018 relative performance of the top 10% of players in the league. Very helpful in identifying potential bargains, or overvalued players.

2. For a given goalie this shows the past three years performance (W, GAA, SV%). This came in very helpful during the actual draft when I had to quickly compare multiple goalies.

In the past I largely used Excel to do this type of analysis. What I realized this year is that for any non-trivial type of data analysis like this, Python is much, much, much, easier to use.
Central Equilibrium Talkshow Appearance

In July I was a guest on Eric Cai’s YouTube talkshow The Central Equilibrium. In the episode I discuss different sets of numbers (natrual, integer, rational, irrational, real, complex), prove that the square root of 2 is irrational, define injection/surjection/bijection, and finish by proving the rational numbers are countable.
It was a great learning experience for me as it was one of the few times I have ever formally taught math.
Links to the videos, and PDF of the show notes below:
Review of Deeplearning.ai Courses

I just finished courses 1-4 in the 5 course Deep Learning Specialization on Coursera. For those considering enrolling, here are some of my thoughts.
Overall Review
The specialization will give you some intuition about how deep learning works, however most of this comes in the first two courses. The lecture videos are well done and Andrew Ng is a clear lecturer. The programming assignments were disappointing.
Where I Was Coming From
I will be beginning my MSc Statistics at the University of Toronto this fall, and will be taking a number of machine learning courses. I enrolled in this specialization to get a small preview of what I will see in these courses, as well as to improve my programming skills. This past year I took courses in linear algebra and multivariable calculus so none of the math in the courses was new to me.
Cost & Time
The course works on a subscription basis where you pay $49 USD a month (~$65 CAD). On average each course in the specialization takes fifteen hours to complete.
Positives
- The course is very approachable and the lecture videos are easy to follow along with.
- The Heroes of Deep Learning videos (interviews with famous names in the machine learning community) are terrific. Each interview subject has a unique perspective and gives their advice for anyone interested in breaking into the field.
- The course has been quite popular, and as a result the forums have lots of archived advice/tips if you get stuck on an assignment.
- The assignments are completed in Jupyter Notebooks hosted by Coursera. Given this is a fairly popular programming environment, it was great to get some experience with it.
Negatives
- My biggest issue with this course was with the programming assignments. Obviously Andrew Ng wanted to make the course accessible to a wide audience, so I was not expecting the assignments to be overly difficult. However, the assignments tended to be either incredibly easy (aided by some hints which at times provided nearly all of the code you needed to input), or overly structured (instead of being tasked with a problem to solve, you are tasked with filling in snippets of code in a nearly solved problem). I had previously taken the course An Introduction to Interactive Programming in Python which had a much better assignment format. In that course you were given a problem to solve, a couple of hints, and then you coded up a solution from scratch.
- The course had a very heavy focus on computer vision. It would have been nice if it had devoted more time to other areas where deep learning is being applied.
- My personal learning style was to paste the lecture slides into OneNote and take notes on top of them. However for several videos the lecture slides were missing (i.e. Ng would lecture using a set of slides but you could not download them). For an online course that costs money this seemed inexcusable.
Final Thoughts
If I were to do it again I think I would have just done the first two courses, and instead of courses 3 and 4, devoted my time to building things from scratch or trying a Kaggle competition with what I had learnt. For those looking to get a better understanding of what deep learning is at a high level, I would recommend checking out the first two courses in this specialization.
World Cup Finals 2018 – Who is Toronto Cheering For?
A follow-up to my earlier data visualization (World Cup 2018 – Who is Toronto Cheering For?).
Blue represents census tracts where the French population outnumbers the Croatian population. Red represents census tracts where the Croatian population outnumbers the French population.

Book Review – Prediction Machines

Recently I read Prediction Machines by Ajay Agrawal, Joshua Gans, and Avi Goldfarb, three professors from UofT’s Rotman School of Management. I recommend this book to anyone who wants to go ‘beyond the headlines’ with respect to what impact on the world machine learning & AI will have.
Topic
“Where others see transformational new innovation, we see a simple fall in price.”
The key idea the book revolves around is that machine learning & AI have brought about a dramatic fall in the price of prediction. The authors argue this fall in price will lead to the emergence of new business models (similar to how new business models emerged as Google search became popular), and it will also increase the value of other things (e.g. sensors which accurately capture data will become more valuable).
Review
This may be the best book yet I have read in the ‘machine learning/AI/robots will transform our world’ genre. Part of the reason why is that Prediction Machines does not try to do too much. The authors focus on a few key ideas (as mentioned above), and then carefully evaluate the ramifications of them. The authors’ writing style is clear (the chapter-by-chapter bullet points help with this), and back their arguments up with numerous real-world examples. The book is similar in some ways to Martin Ford’s Rise of the Robots, and the overall style is reminiscent of Robert Shiller’s Animal Spirits.
Two things I was not wild about. I found the section ‘Part 3: Tools’ a bit dry, and wish the authors had gone into a little bit more detail about how machine learning actually works (potentially via an appendix).
Best Bits
A few sections/arguments/examples I found interesting:
- Rating agencies’ models before the financial crisis did not sufficiently incorporate how housing prices are correlated across regions. “Machine learning enables predictions based on unanticipated correlations”, and this feature could have been helpful at the time. (pg. 37)
- “The value of substitutes to prediction machines, namely human prediction, will decline. However, the value of complements, such as the human skills associated with data collection, judgment, and actions, will become more valuable.” (pg. 81)
- “The recent developments in AI and machine learning have convinced us that this innovation is on par with the great, transformative technologies of the past: electricity, cars, plastics, the microchip, the internet, and the smartphone”. (pg. 155)
- The authors cite an interesting example of how in the 1930s a new strain of higher yielding corn took a very long time to become widely used in some states (e.g. Texas, Alabama). Part of the reason for this was that farms in these states were smaller & less profitable, making experimentation on new corn varieties hard to justify. The authors argue that the large profit margins of firms like Google/Facebook are enabling them to experiment broadly with AI techniques, and “reap huge rewards from successful experiments by applying them across a wide range of products operating at large scale”. (pg. 160)
World Cup 2018 – Who is Toronto Cheering For?

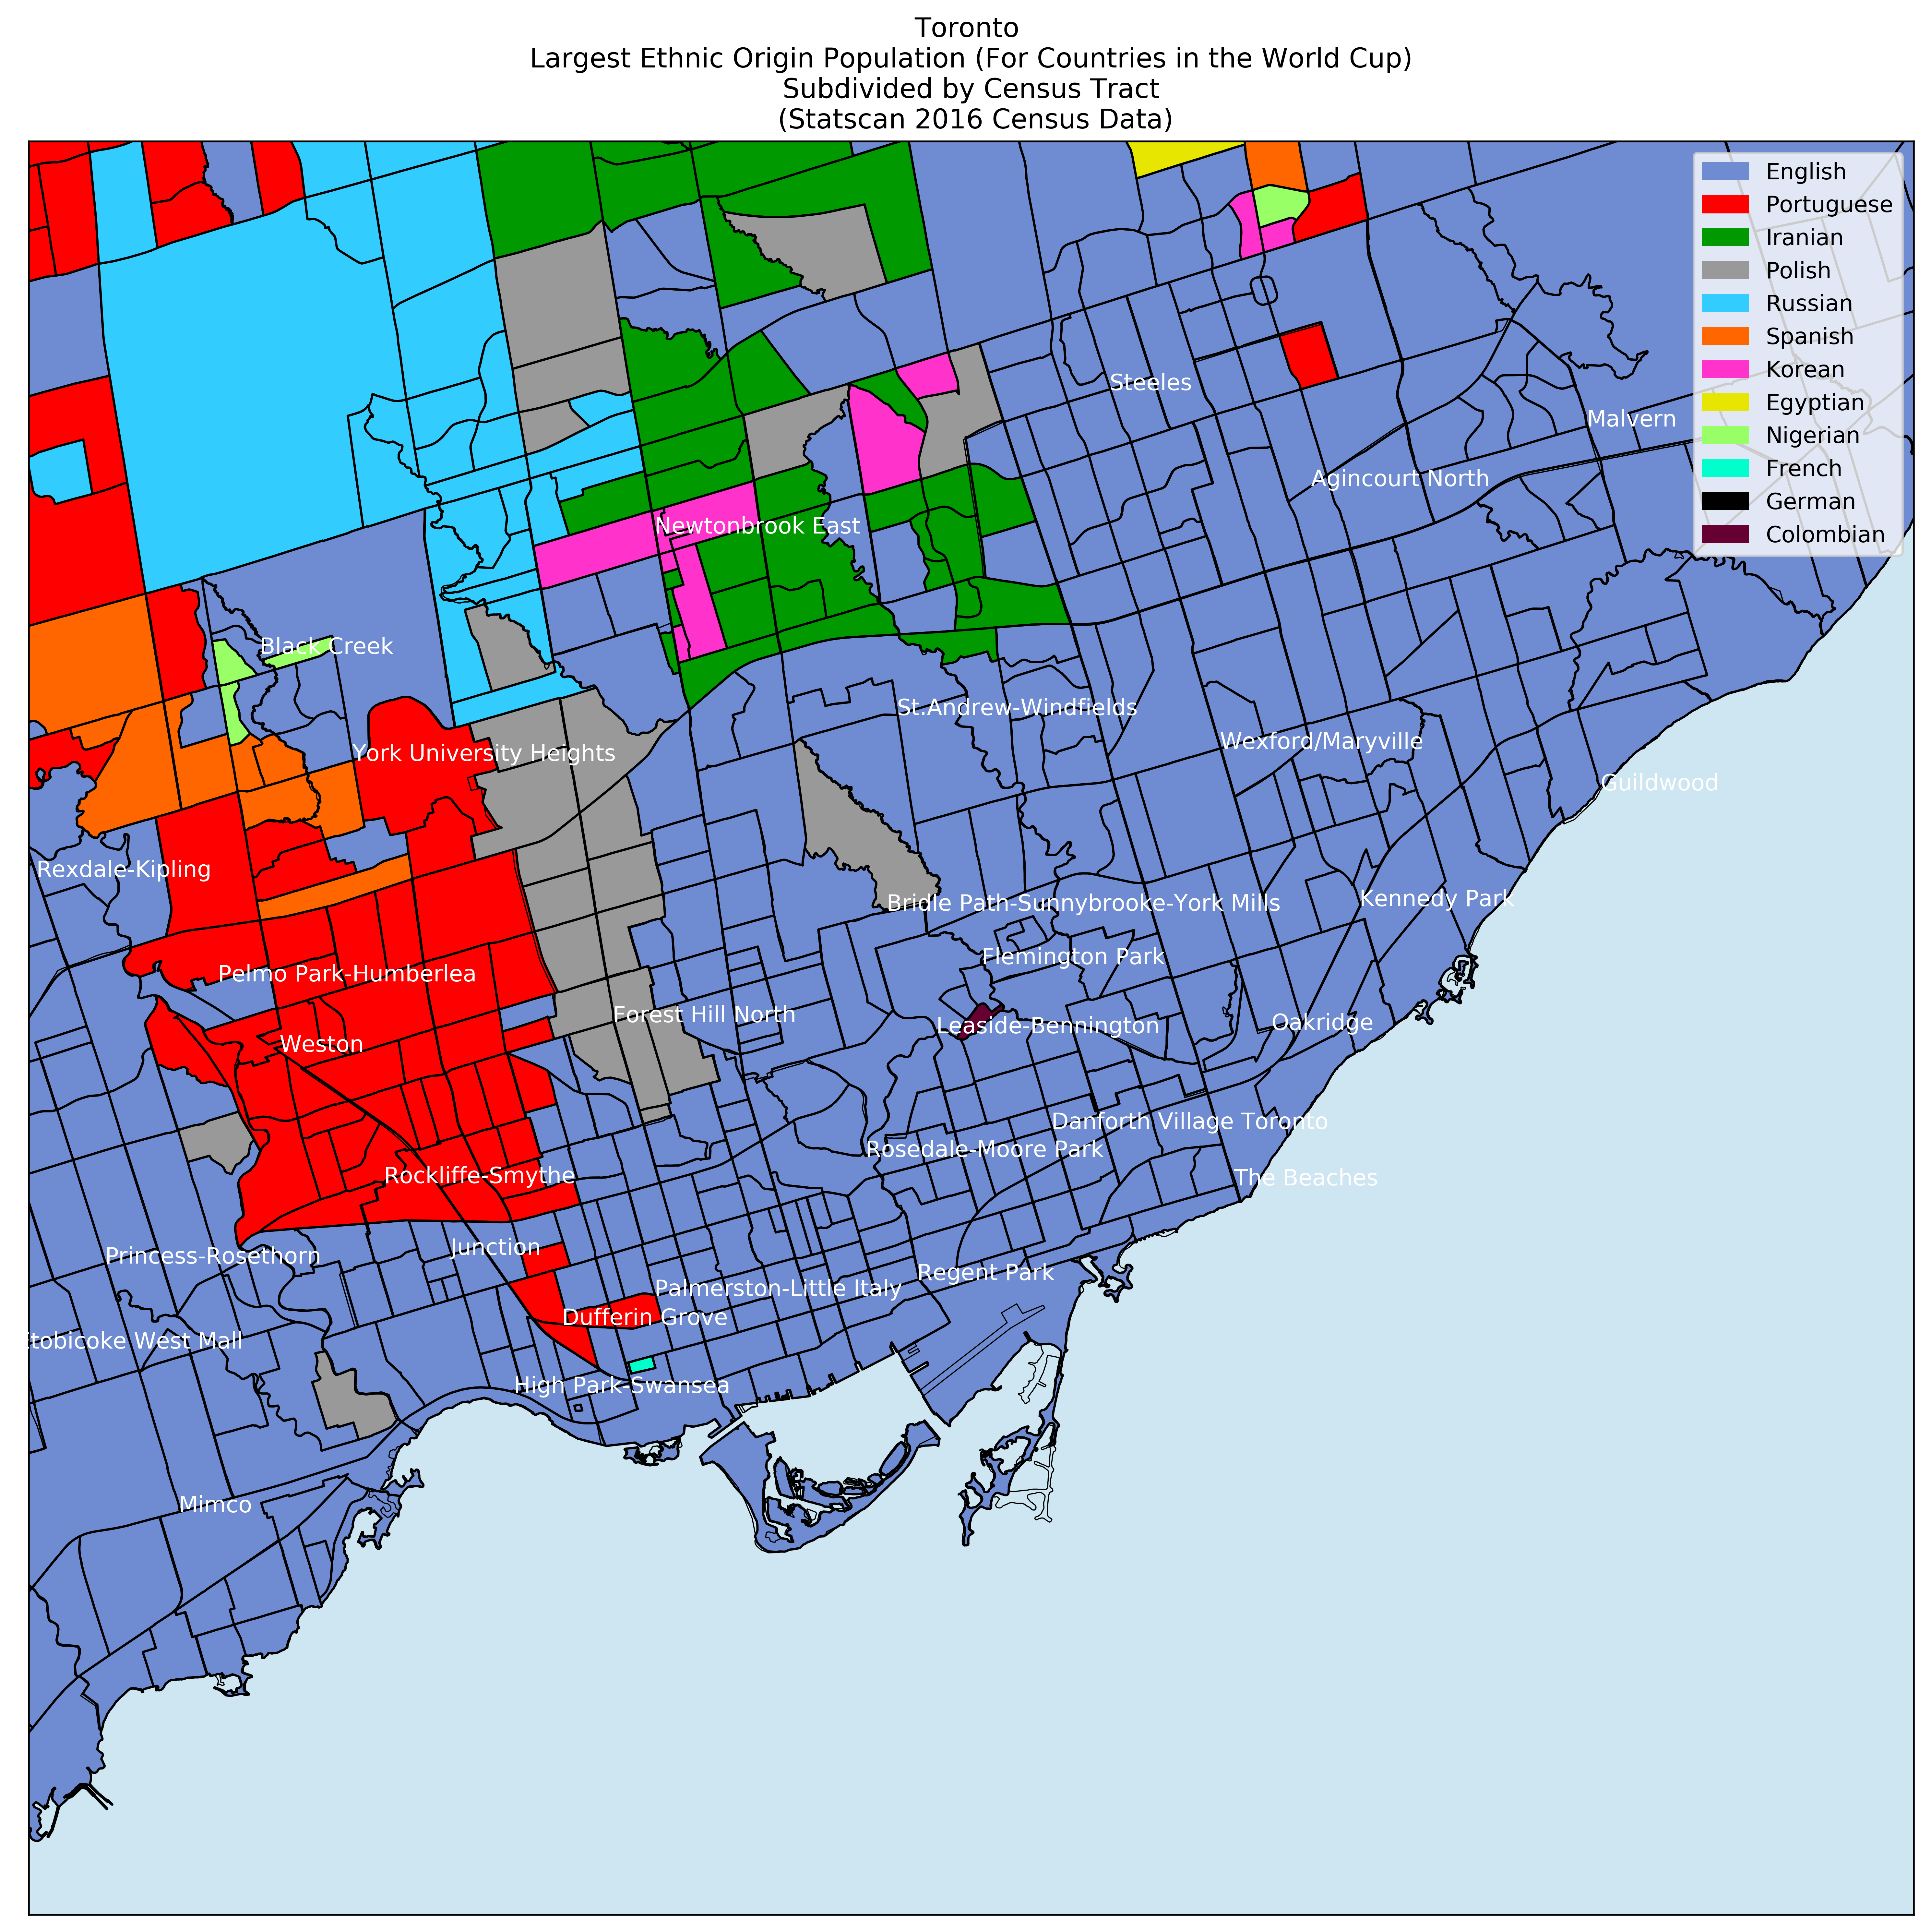
Toronto, being the multicultural city that it is, takes the World Cup very seriously. But who is Toronto cheering for this World Cup? 2016 StatsCan census data can give us a clue.
The Data
I originally came up with the idea for this visualization when writing an article on the 2018 Ontario election that used StatsCan census data. The census data includes information on ‘ethnic origin population’ by census tract (a very small geographical region, in downtown Toronto it would represent only a few blocks). With this data, and a map of census tracts (available from StatsCan in the form of ‘shapefiles’), I set out to map who Toronto would be cheering for.

The Maps
Plotted using Matplotlib Basemap. For each census tract I picked the ethnic origin (of countries in the 2018 World cup) that has the largest population. Note that ‘English’ as an ethnic origin dominates the original map, so I have plotted two separate maps, one including English and one without. Also note, the map would look a little different if Italy had qualified.
As the World Cup progresses I hope to create more maps with only the teams that are left, or create maps for individual games.
Links to high resolution maps at the bottom of the article.
Enjoy!


Reflection / Technical Roadblocks
Coming off the heels of my election analysis I was more comfortable using pandas/matplotlib which made the analysis easier. This was because I had more confidence in what steps I would need to take in order to get the data into the format I wanted. The biggest technical roadblock, which I ultimately had to ‘hack’ my way around, was the 2016 Census shapefile from StatsCan was incompatible with Basemap (in 2016 StatsCan began to publish these files using a new geographical projection). My multiple attempts to convert it into a compatible file failed, so I ultimately had to revert to using the 2011 census shapefile and interpolate data for a handful the tracts. Not an ideal solution, and I have reached out to StatsCan to get the 2016 file in the proper format so I can update the maps using it as the World Cup progresses.
Some helpful pandas functions I ended up using were:
# for printing out large for dataframes for exploration/debugging

pandas.set_option('display.max_rows', None)
# for finding the maximum column for a given row of a dataframe

DataFrame.loc[row_index].idxmax()
This analysis once again hammered home the 90%/10% rule; I spent 90% of my time on data cleaning/preparation, and 10% on everything else. All in all, it was a good project for getting familiar with python mapping tools, and practicing data cleaning/prep.
Links
Ontario Election 2018 – Where Might the NDP Outperform?

Note this is not a left/centre/right/Conservative/Liberal/NDP partisan piece. I did my best to step back and assess the current race objectively.
I have always had a strong interest in politics, and with the upcoming Ontario provincial election on June 7th I decided it was a good opportunity to put some of my newly acquired data science skills to use.
Defining the Problem
With election day fast approaching I had to decide on a problem. One of the things that struck me was how Wynne vs. Horwath (the Liberal & NDP candidates respectively) match-up similarly to Clinton vs. Sanders. Wynne/Clinton lean more centrist/establishment whereas Horwath/Sanders are more left/anti-establishment. I decided to investigate what factors led a county in the United States to vote for Sanders over Clinton, and learn from this what ridings the NDP have a good chance of taking from the Liberals this election (as of writing the Liberals are expected to lose a number of seats to both the PCs and NDP).
Methodology
Towards this goal I created a simple logistic regression model to predict whether a county voted Clinton or Sanders during the 2016 Democratic primaries. To make the analysis transferable to Ontario I trained the model on states close in proximity to Ontario, plus some west coast states that are somewhat similar (NY/NJ were excluded since Clinton’s term as senator for NY could bias the model in those states).

I ended up using exclusively economic predictor variables in this model (specifically unemployment rate in a county vs. national average, percent of jobs that are blue collar (by industry), median income as a ratio of average median income, and percent of individuals with a Bachelor’s degree or higher). I initially planned on using a immigration predictor, but ran into the issue of Ontario having a much higher proportion of its population being foreign born; in fear of extrapolating I decided to throw it away.

For the data I was able to get US Democratic primary results from OpenDataSoft, US county-level census data from the US Census Bureau’s American Fact Finder, and Canadian demographic data from StatsCan’s National Household Survey.
The Model

After training the model on US data, I then ran a hypothetical scenario. Assuming Ontario provincial ridings were in the US, based on my model, what was the probability they would have voted for Bernie Sanders. The intuition behind this is that if a riding shares characteristics with counties that were supportive of Bernie Sanders, it would not be too big of a stretch to think they could end up supporting the NDP this election.
Ridings to Watch
The model, based solely on economic factors, identified the following ridings as those the NDP could do well in vs. the Liberals.

Given how the model is constructed, and how many factors are not included, it is best to use this as a preliminary screen. For example, the Liberal vs. NDP analysis is irrelevant in Etobicoke North (the riding is almost certainly going to elect Doug Ford who won ~80% of the mayoral vote in Etobicoke North in 2014).
Some Riding Predictions
I am not pretending to have a massive amount of confidence in these predictions, although they are a useful exercise in assessing this line of analysis after the election. Ridings I was less comfortable predicting were those where the NDP were distant 2nd/3rd place in the 2014 election; it seems even with the strength in the polls one has to go out on a limb to confidently predict those.
University–Rosedale/Toronto Centre/Spadina–Fort York: These three ridings represent what was previously just ‘Toronto Centre’. 2014 saw 46% Lib, 30% NDP, 13% PC. These score well in the model, and with the Liberals fading in the polls in Toronto, I believe an NDP sweep of these ridings is likely.
Willowdale: Despite scoring highly in the model, since 1987 the NDP has never placed better than 3rd, and 2014 saw 52% Lib, 33% PC, 10% NDP. I am less enthused with the NDP’s chances here.
Ottawa Centre: The riding has flipped between Liberal and NDP since its creation in 1967. 2014 saw 51% Lib, 20% NDP, 18% PC. This riding should be close, but I predict a NDP upset.
Parkdale–High Park: The NDP incumbent Cheri DiNovo is no longer running. 2014 saw 41% NDP, 40% Lib, 13% PC. I predict a NDP landslide victory.
Windsor West: NDP candidate Lisa Gretzky will win once again.
London North Centre: The NDP came second here in 2014, and are polling generally well in southwestern Ontario. 2014 saw 35% Lib, 30% NDP, 26% PC. This riding, which includes UWO, is a strong candidate for a NDP victory.
Waterloo: A new riding split out from the old Kitchener–Waterloo. Scores high on the model, NDP incumbent, plus contains two universities. Very strong NDP victory.
Process/Lessons
- When I first set out to do a data science project on the Ontario election I figured the data I would need would be relatively accessible, and I could spend most of my time conducting the analysis instead of data cleaning/manipulation/etc. In reality ~90% of the work was in getting the necessary data into pandas dataframes and then learning how to manipulate it into a format conducive for analysis. One time consuming task was cleaning the Democratic primary results; for some reason the results were broken down by county for some states and by municipality for others. Another frustration was working with the StatsCan National Household Survey CSV file where certain rows had the same row name but represented different values. With the election fast approaching I ended up having less time for the actual model building than what would have been ideal. A lesson for next project is to leave myself more time for data preparation.
- I also learned fairly late in the process that the StatsCan household survey data was somewhat stale, so for next time it will be important to be a bit more careful choosing data sources.
- This was one of my first times using pandas and some functions that came in handy were dataframe.merge(), dataframe.iterrows(), dataframe.shape, dataframe.unique()
Link to Github (code is in Ont2018ElectionModel.ipynb)
6/11/2018 POST-ELECTION UPDATE
In the election the PCs secured a majority and the Liberals only managed to win seven seats. I went perfect on my predictions of nine ridings, although I do so humbly given my predictions were relatively ‘safe’. I was happy that I overrode the model in Willowdale where the NDP finished third. Also I was happy with Ottawa Centre where initially I was hesitant to forecast the NDP would win given the large Liberal margin 2014. Also, I did not predict Don Valley East/West/North given I did not think my model captured all the dynamics at play there (especially in Wynne’s own riding); in retrospect that was the right decision.
What I am most happy about is how the model seemed to fare overall. Of the ridings that were in existence in both 2014 & 2018 the model did seem to pickup features (reflected in high ProbabilityVoteSanders scores) that would help the NDP improve their vote count vs. the Liberals (chart below).

One lesson that was hammered home again in doing this post-election analysis was the rule that 90% of your time is data cleaning vs. 10% analysis. I was disappointed that a simple and clean breakdown of 2014 results was not accessible in CSV format from ElectionsOntario; and I was lucky a UofT prof posted the 2018 results in a nice format. Plus the redrawing of ridings meant I had to throw out some of the data given I was not able to get a clean 2014 vs. 2018 comparison. That being said, given my experience getting the data for the initial model, I had a better grasp of what was needed to get the data into the required format.
Overall I am happy with the results. Part numerical analysis, part common sense, and I was able to correctly predict some ridings. A good first attempt at political forecasting.